OmniMES has a new module that lets users build analytical charts directly from inside the application — without clicking around Redash and without knowing SQL. The whole flow rests on three building blocks: base JSON queries, the Query Results editor powered by Redash's SQL engine, and an AI assistant that helps at every step.
Where this feature came from
Until now the path from "I want a chart showing energy consumption per machine" to a working dashboard widget required:
- manually creating a base query in OmniMES,
- switching over to Redash,
- writing SQL that joins the results,
- configuring the visualization (chart type, X/Y axes, colors, aggregations),
- adding the widget to the right dashboard.
Each of those steps was a separate, slow and error-prone stage. The new module merges them into a single smooth flow that runs entirely inside the OmniMES UI.
How it works — step by step
1. Base JSON query (data source)
The user defines what to pull from the system and for which time range (machines, event types, time window, aggregations). The wizard generates the configuration as a URL pointing to the OmniMES API, which Redash calls each time the query is executed. The result is a solid, parameterized data source — ready for reuse.
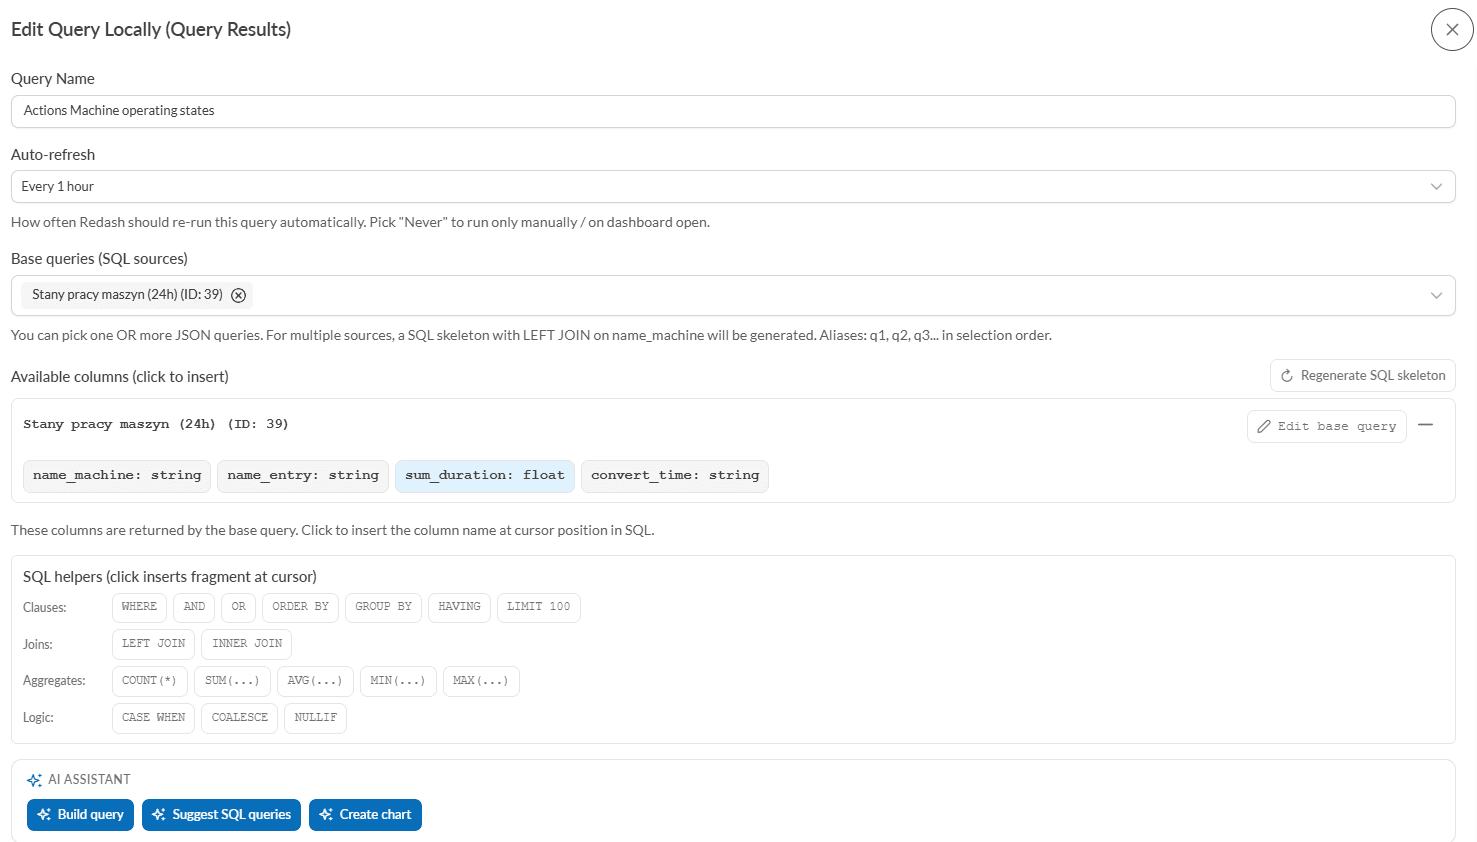
2. Query Results (joining and transforming data)
The second query type lets you write SQL on top of the results of base JSON queries — aggregate, filter and join several sources by name_machine. The SQL editor offers:
- autocompletion and syntax highlighting,
- columns available from the base queries inserted into the SQL with one click,
- shortcuts for common constructs (WHERE, GROUP BY, JOIN, COUNT, SUM, CASE WHEN),
- an SQL skeleton generator when multiple sources are selected,
- a validator that detects the old Redash v10 syntax and migrates it to v26 in a single click, propagating dashboard parameters,
- a Check execution button that runs the query in Redash with a default 30-day window and shows the results in a table — without leaving OmniMES.
3. AI assistant — three modes of help
The Query Results form offers three AI-driven buttons (the LLM is configured in OmniMES settings):
- Build query — describe in plain language what you want ("show the top 10 machines with the highest energy consumption last week") and the AI generates SQL aligned with the columns of the selected base queries.
- Suggest SQL queries — the AI proposes a few sensible queries on its own, based on the structure of the chosen data sources. Click, pick, done.
- Create chart — the most important new capability. The AI analyzes the SQL and the output columns, proposes the best chart type (bar, line, pie, scatter, heatmap), picks the X/Y axes, aggregations, sort options and labels. The user can edit the proposed title, choose a target dashboard from the list or create a new one — and with a single click publish the visualization in Redash together with the widget on the dashboard.
4. Dashboard parameter propagation
Every widget created this way is automatically wired to the dashboard's global date picker — changing the time range in the picker propagates to every query, including the base JSON ones. The user gets a coherent, interactive dashboard without having to configure parameterMappings by hand.
What this means in practice
- Dashboard build time drops from hours to minutes. A production operator, a process engineer or a department manager — anyone can build a chart that analyzes production, energy or quality data on their own.
- Only domain knowledge is required. The AI handles the translation from description to SQL and the choice of visualization type.
- Everything stays inside the OmniMES + Redash ecosystem. The charts produced are first-class Redash objects — you can keep editing them, copy them, embed them via iframe, set up alerts.
- The AI runs locally or remotely. OmniMES supports both its own Ollama (models running on-premise) and OpenAI-compatible APIs — the choice depends on the customer's data-privacy policy.
Who benefits
- Operators and shift managers — fast ad-hoc analyses without waiting for IT.
- Process engineers — exploration of historical data and efficiency comparisons.
- Energy auditors (OmniEnergy) — building consumption reports, baselines and EnPI indicators with no developer involvement.
- Executives — the path from "I need to see this" to "I see this" measured in minutes.
Summary
The new OmniMES feature introduces a democratization of manufacturing analytics — any user with access to the system can build a meaningful chart from real data, using the AI assistant as a translator between business language and the language of SQL and visualizations. It is another step toward an MES that thinks together with the user — not just one that collects data.