Save energy with
OmniEnergy
The system supports ISO 50001 standard implementation, optimization of energy and utilities consumption, energy data analysis, alerting and reporting.
Real-time monitoring
24/7
Annual savings
even 200k PLN
Reduction of energy consumption
5-15%
Comprehensive energy management system
The system supports all ISO 50001 standard requirements, ensuring complete control over energy consumption
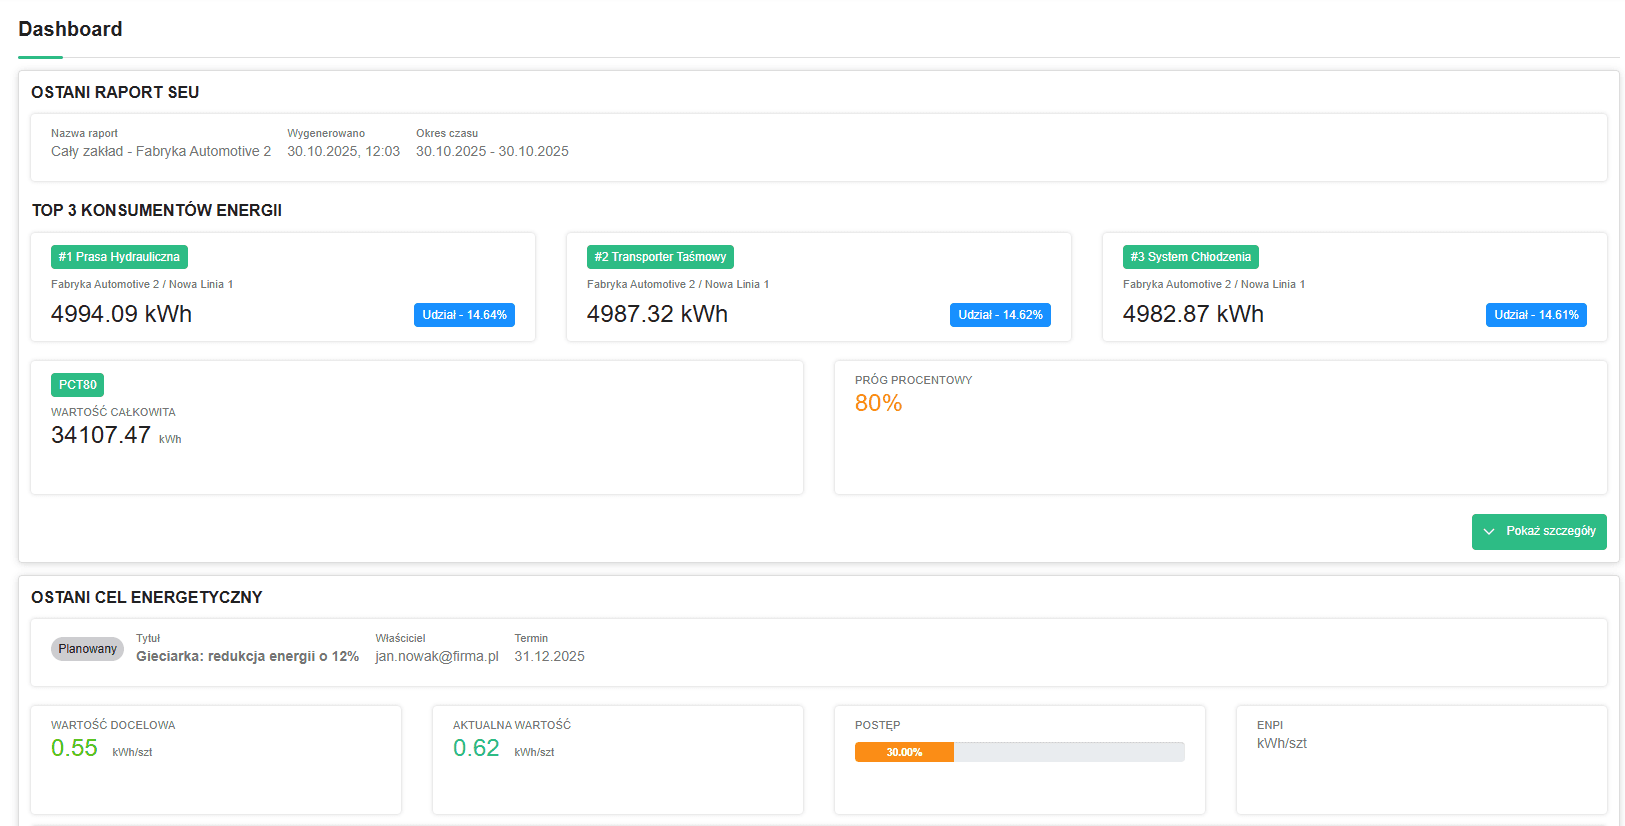
Energy dashboard
Main starting point of the EnMS system with energy consumption charts, SEU, EnPI, action progress and threshold alerts
- Real-time charts
- Tiles for all utilities
- Alerts and notifications
Sources and measurement points
Tabular view with map/planogram of each device linked to production line and energy carrier
- Monitoring of all points
- Sensor statuses
- Planogram visualization
Consumption analysis
Daily, weekly, monthly trend charts with year-over-year comparison and SEU view
- Trend analysis
- Pareto and heat maps
- Multi-period comparisons
EnPI indicators
List of energy performance indicators with graphical trend view and baseline relationship
- kWh/piece, MJ/ton
- Trends and baseline
- Advanced filters
Energy baseline (EnB)
Defining baseline period and its values with ability to compare with current period
- Baseline periods
- Data normalization
- Period comparisons
Energy objectives and actions
Board with objectives, target values, responsible persons and deadlines with implementation status
- Objective management
- Color-coded statuses
- Monthly reports
Audits and reviews
Audit schedule with checklists, results history and PDF export capability
- Audit schedule
- Audit checklists
- Report export
Energy documentation
File repository with energy policy, reports, procedures and links to ISO standards
- Document center
- Version history
- ISO 50001 compliance
Significant energy uses (SEU)
Identification and monitoring of areas with highest energy consumption with optimization capability
- Pareto analysis
- Action prioritization
- 24/7 monitoring
Full compliance with ISO 50001 standard
System designed in accordance with international energy management standard requirements
Context of the organization
Analysis of internal and external factors affecting the Energy Management System, determination of boundaries and scope of the EnMS system
Leadership
Top management commitment, organizational energy policy, roles and responsibilities in the EnMS system
Planning
Energy review, energy baseline (EnB), energy performance indicators (EnPI), energy objectives and action plans
Support
Resources, competence, awareness, communication, documented information necessary for EnMS operation
Operation
Operational planning and control, change management, design, procurement and actions regarding SEU
Performance evaluation
Monitoring, measurement, analysis and evaluation of energy performance, internal audit, management review
Improvement
Nonconformity and corrective action, continual improvement of energy management system and energy performance
Benefits for your organization
Implementation of energy management system brings tangible financial and environmental benefits
Energy cost reduction
15-25% reduction in energy consumption translates into significant savings in operational budget
Regulatory compliance
Meeting energy audit requirements in accordance with energy efficiency law
Carbon footprint
CO2 emission reduction supports sustainable development goals and improves company image
Faster ROI
Return on investment in EnMS system occurs on average within 12-18 months from implementation
Process automation
Automated data collection, reporting and alerting saves team time
Continual improvement
PDCA cycle (Plan-Do-Check-Act) ensures systematic improvement of energy performance
Calculate return on investment
OmniEnergy implementation is not just a step towards digital transformation – it's an investment that can quickly pay off through savings.
- Cloud services
- Software licenses
- Communication gateways, HMI panels, PLC controllers
- System configuration service and implementation costs
- 15% efficiency increase
- 20% energy consumption reduction
ROI indicator at 0.25 level means that the company will save 25% of invested funds value in the first year of system use.
15% efficiency increase
Energy dashboard
Main starting point of the system
Energy dashboard
Main starting point of the system
- Charts: energy consumption [kWh], SEU, EnPI
- Action progress and threshold alerts
- Tiles for electricity, gas, compressed air
- Navigation buttons: Analysis → EnPI → Objectives → Audits
Sources and measurement points
Device and sensor monitoring
- Tabular view + map/planogram
- Each device linked to production line
- Statuses: active, no signal, sensor failure
Automatic energy report
Detailed energy reports generated automatically – ready documents with trend analysis, ISO 50001 compliance assessment and corrective action recommendations.
- Automatic report generation without user intervention
- ISO 50001 compliance analysis
- Energy consumption trends and optimization recommendations
- PDF export with version history


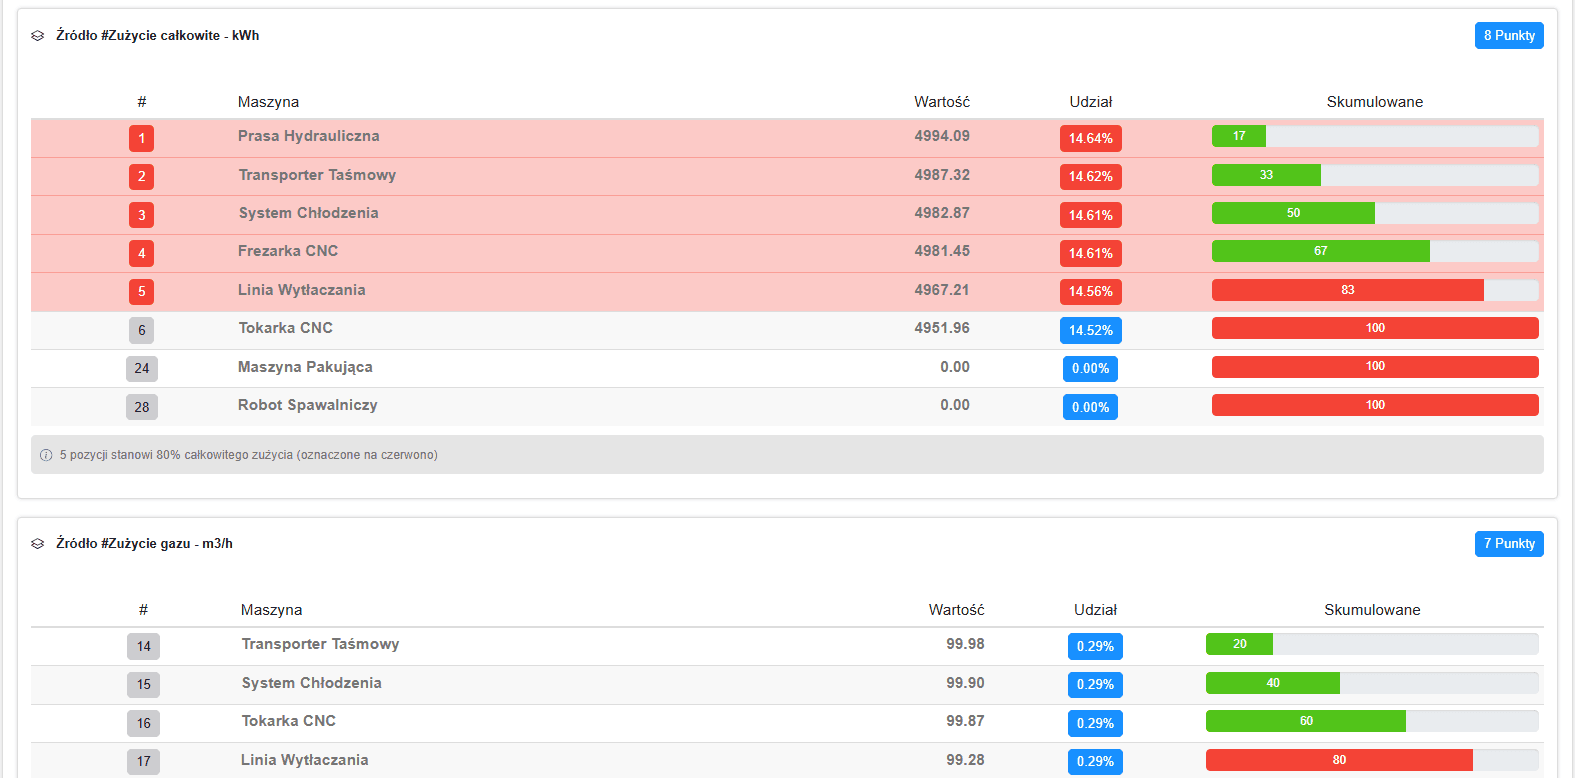
Energy efficiency summary
All media consumption in one place – electricity, water, gas, compressed air. Pareto PCT 80% analysis automatically identifies machines and lines with the greatest impact on energy costs.
- All energy media in one view
- Pareto PCT 80% analysis – automatic detection of significant positions
- Breakdown by machines and production lines
- Fully automated, no manual configuration
Ready for energy optimization?
Join companies that are already saving through intelligent energy management